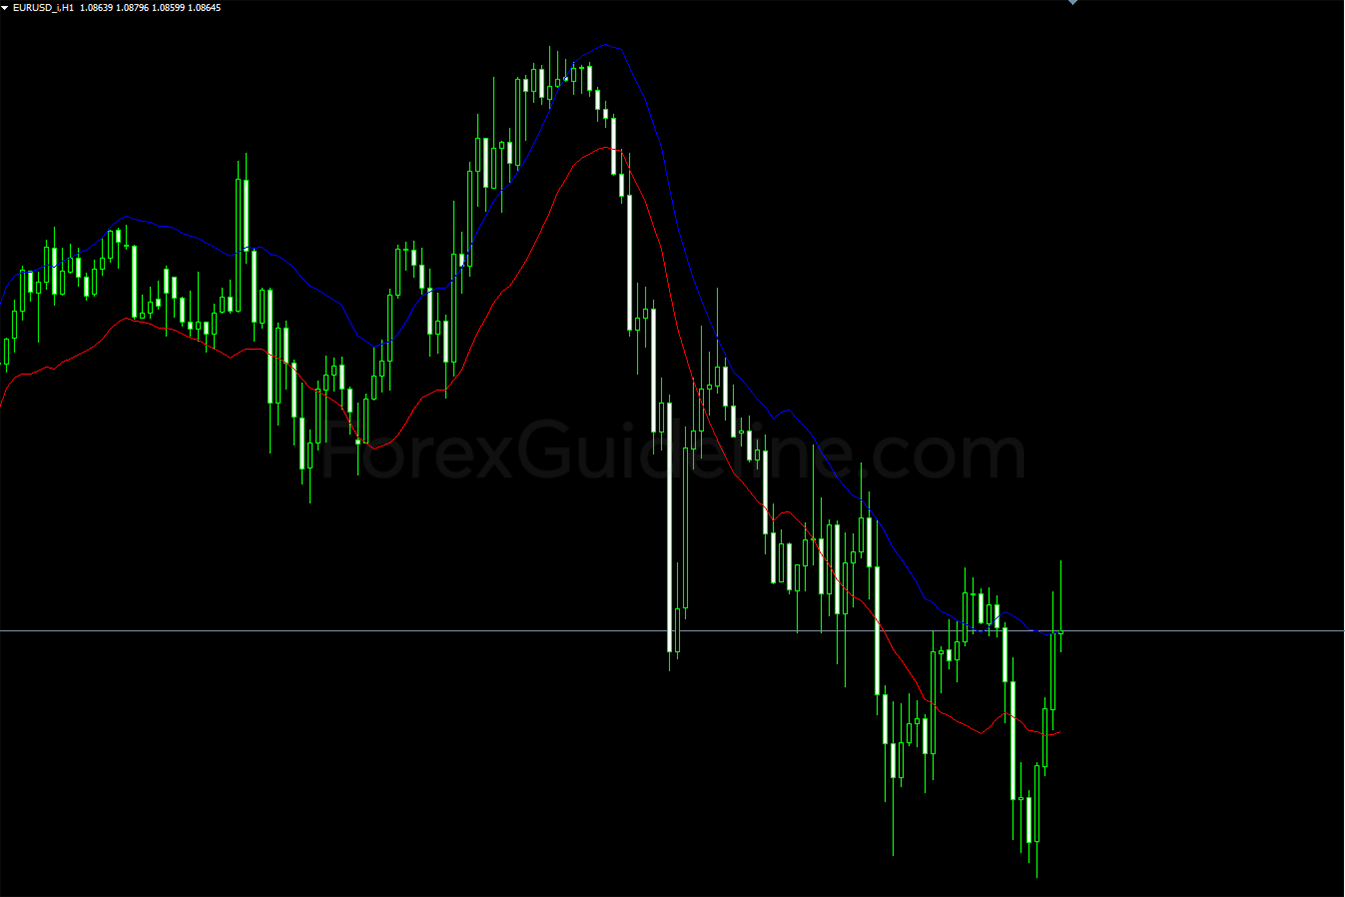
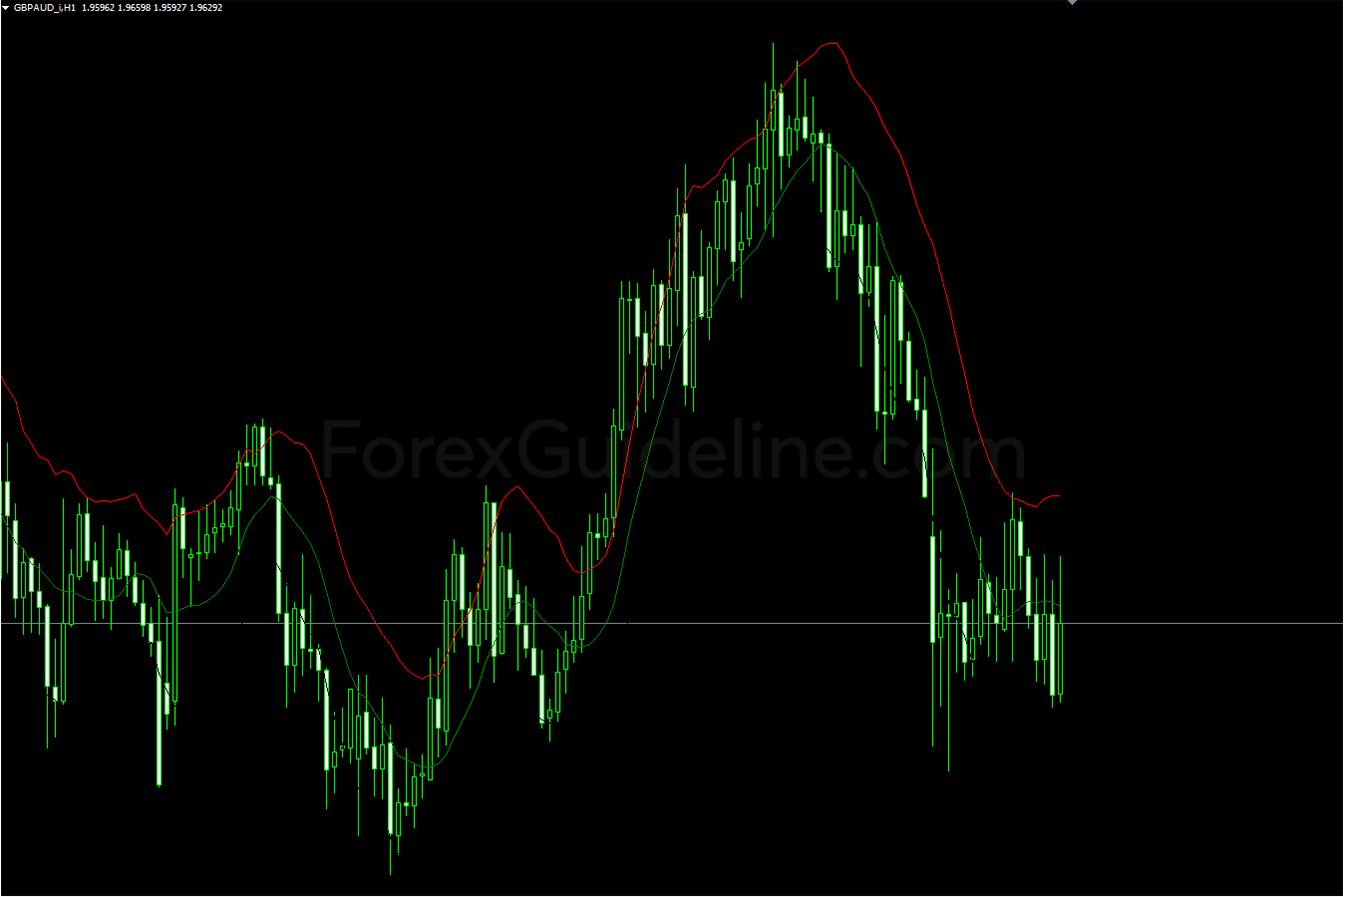
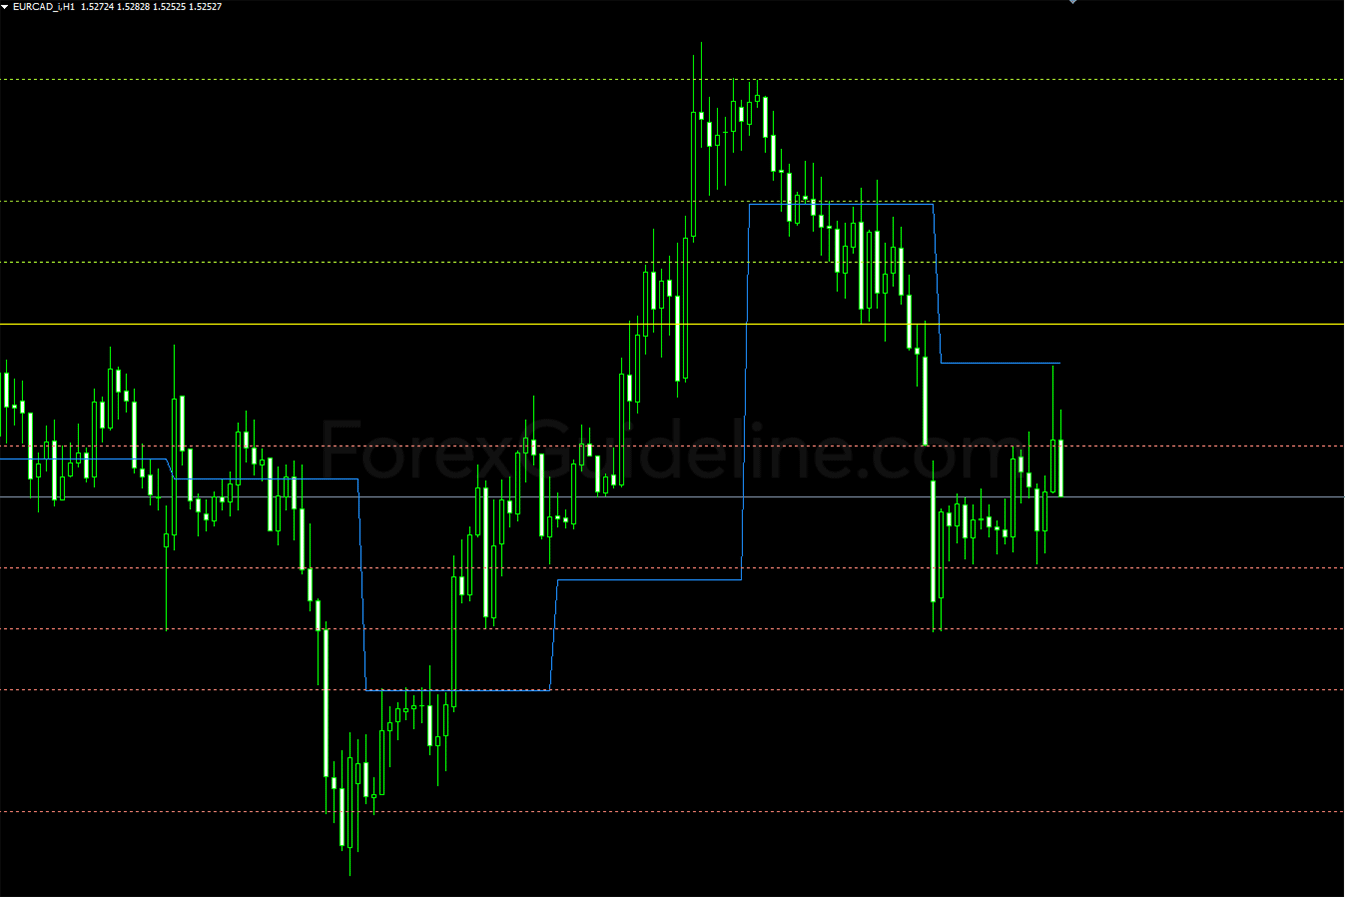
Envelopes Indicator is a technical indicator that show upper and lower bounds. The most common envelope is the moving average envelope, which uses … Read More»
Free Forex Indicators
Donchian Channel Indicator
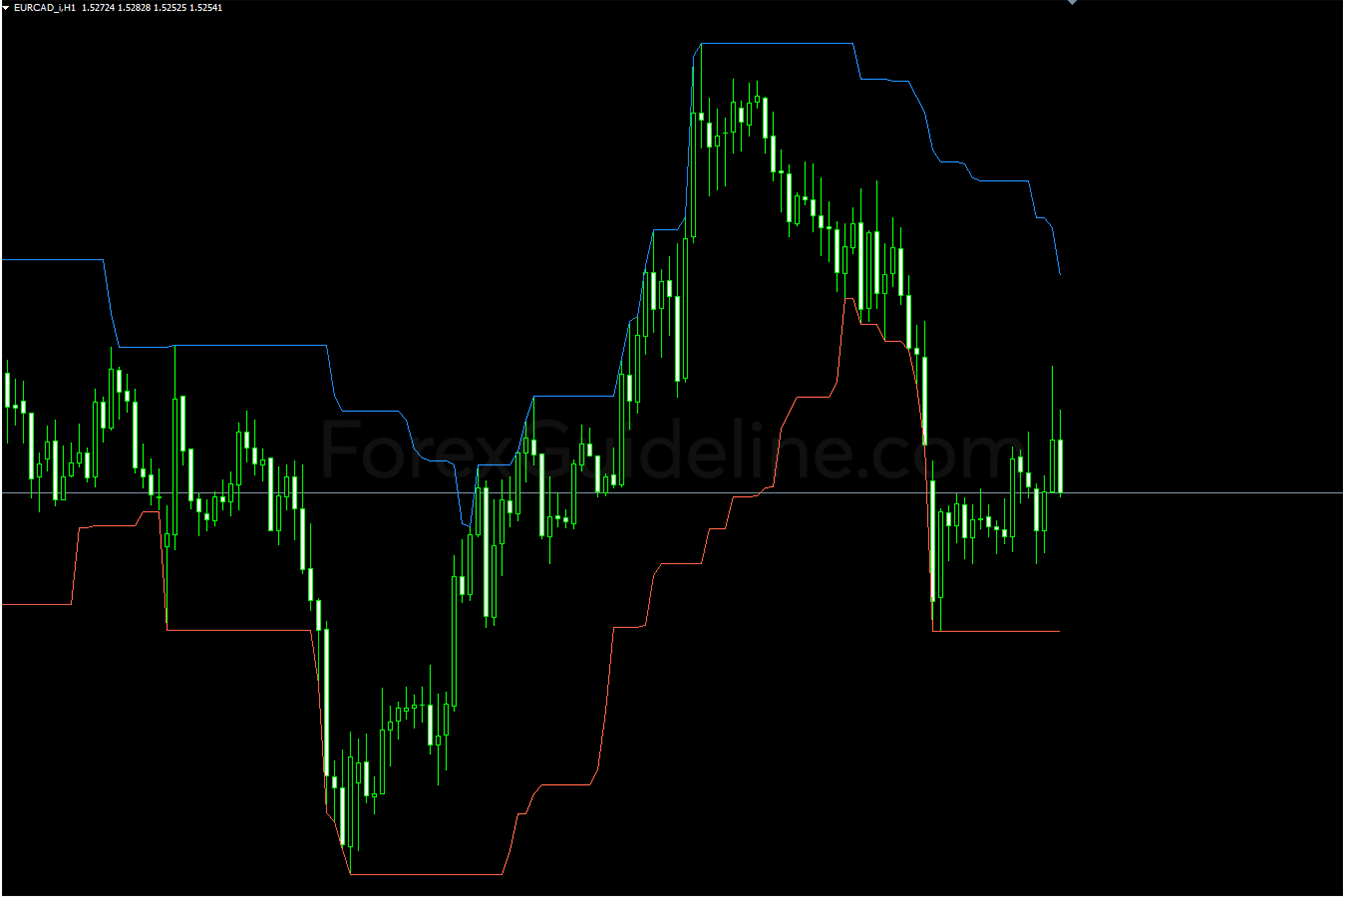
The Donchian Channel indicator draws 3 lines based on moving average calculations formed by upper and lower bands around a mid-range or median … Read More»
Average True Range (ATR) Indicator
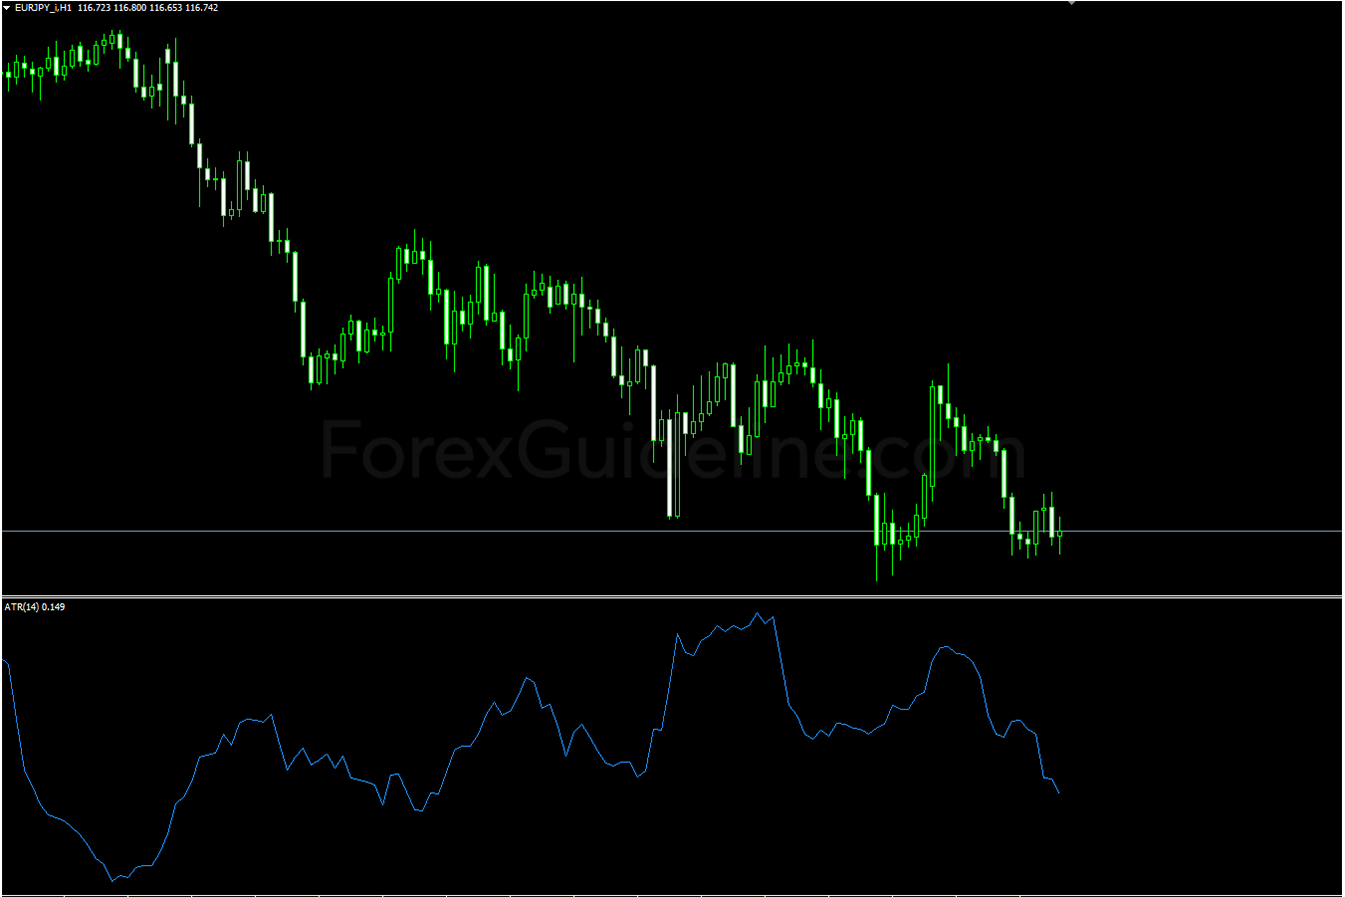
Average True Range (ATR) Indicator is a volatility indicator that shows how much an asset moves, on average, during a given time frame. … Read More»
Bollinger Bands (BB) Indicator
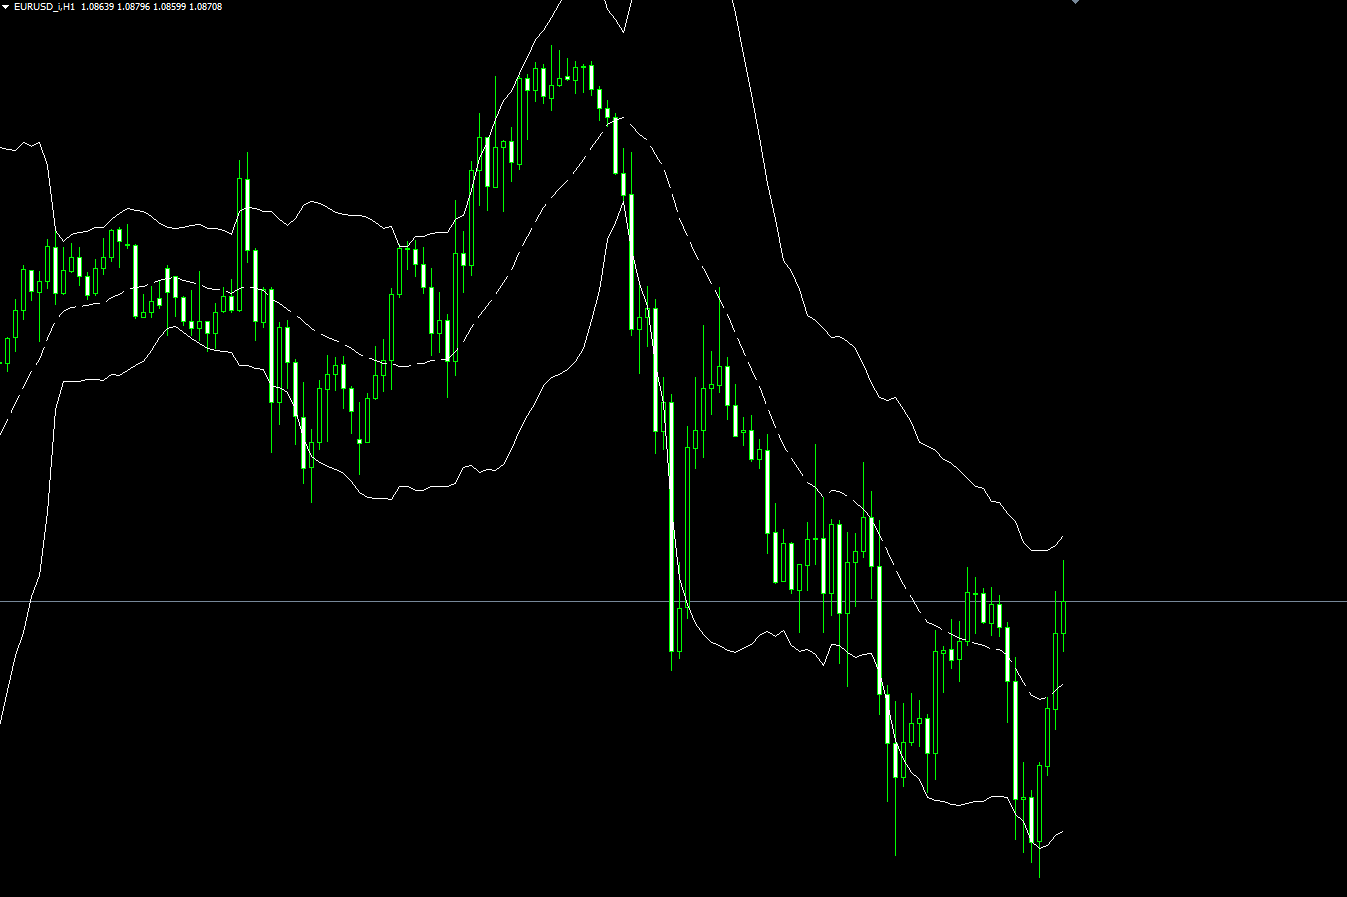
Bollinger Band is a technical indicator that draws 3 lines based on two standard deviations (positively and negatively) away from a 20-day simple … Read More»
Standard Deviation (STDEV) Indicator
The Standard Deviation Indicator (StdDev) measures market volatility based on the asset price standard deviation value relative to the Moving Average. The higher … Read More»
Keltner Channel Indicator
A Keltner Channel is a volatility based technical indicator with 3 separate lines. The middle line is the Exponential Moving Average (EMA) of … Read More»
Commodity Channel Index (CCI) Indicator
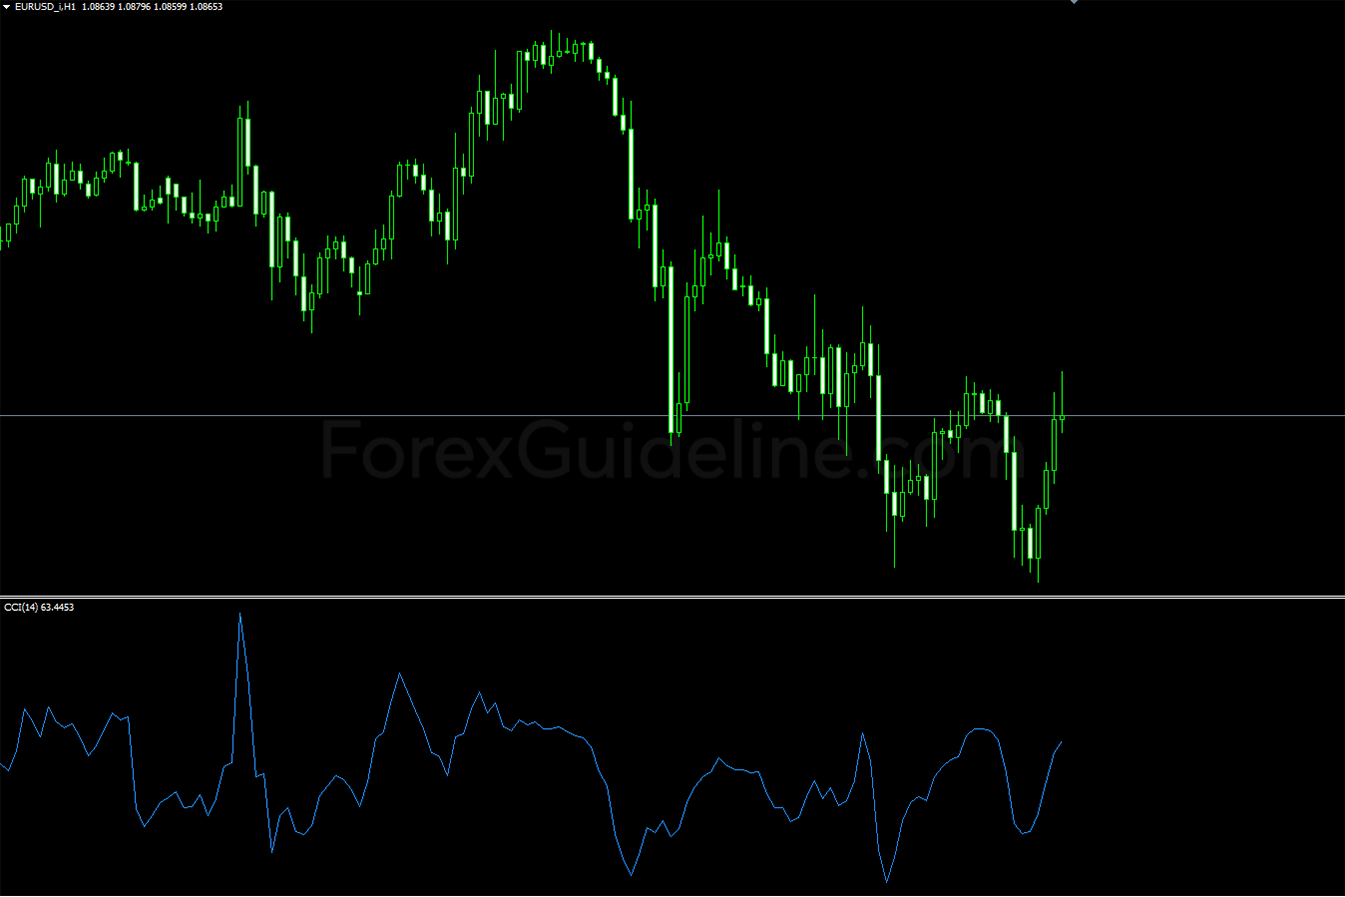
The Commodity Channel Index (CCI) is a momentum-based oscillator that helps traders determine when the market is reaching a condition of being overbought … Read More»
Zig Zag Indicator
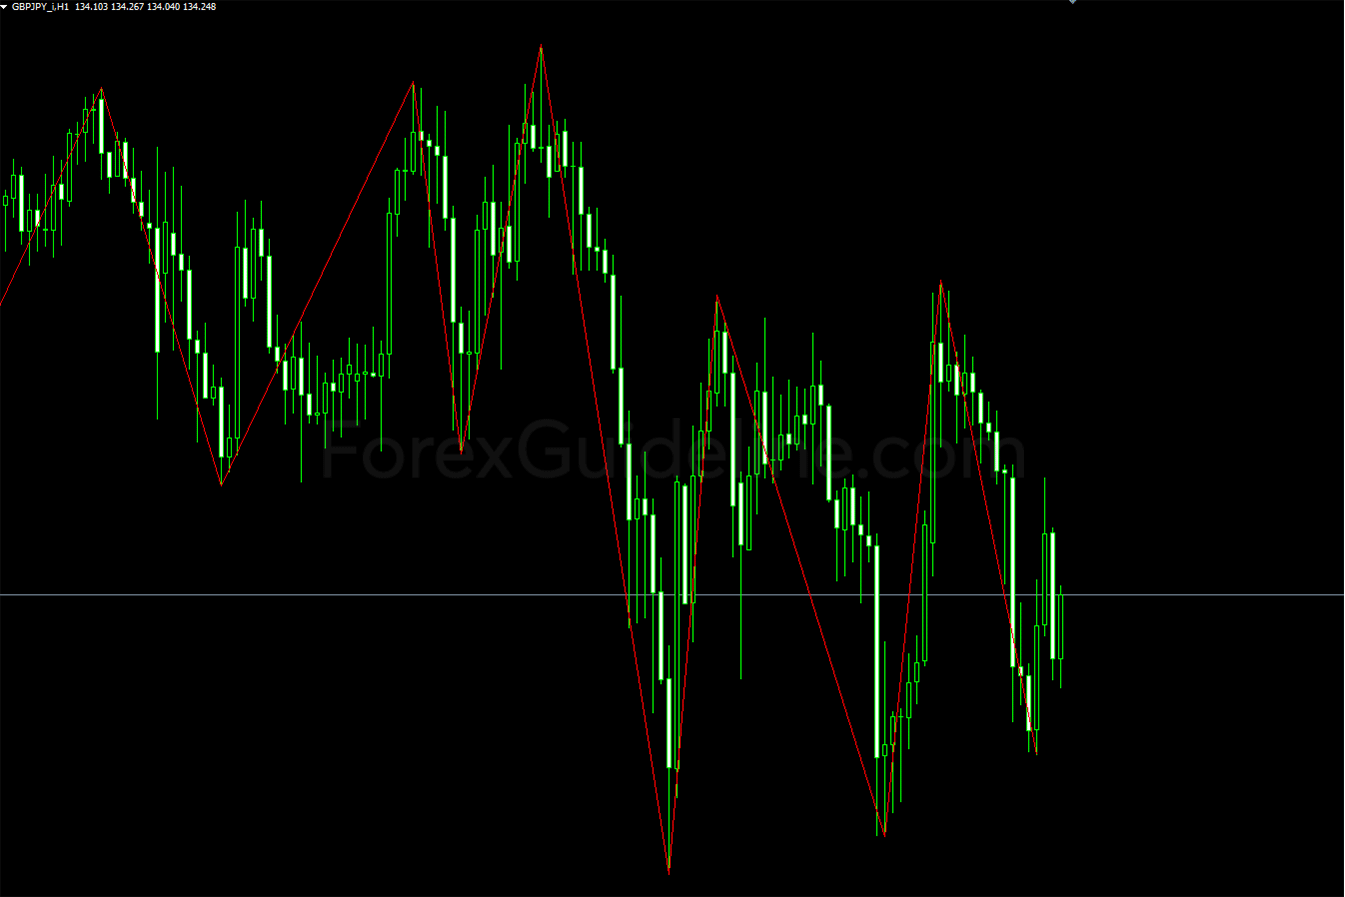
The Zig Zag indicator plots price movement between a swing high and a swing low that is greater than a specified percentage; often … Read More»
Fractals Indicator
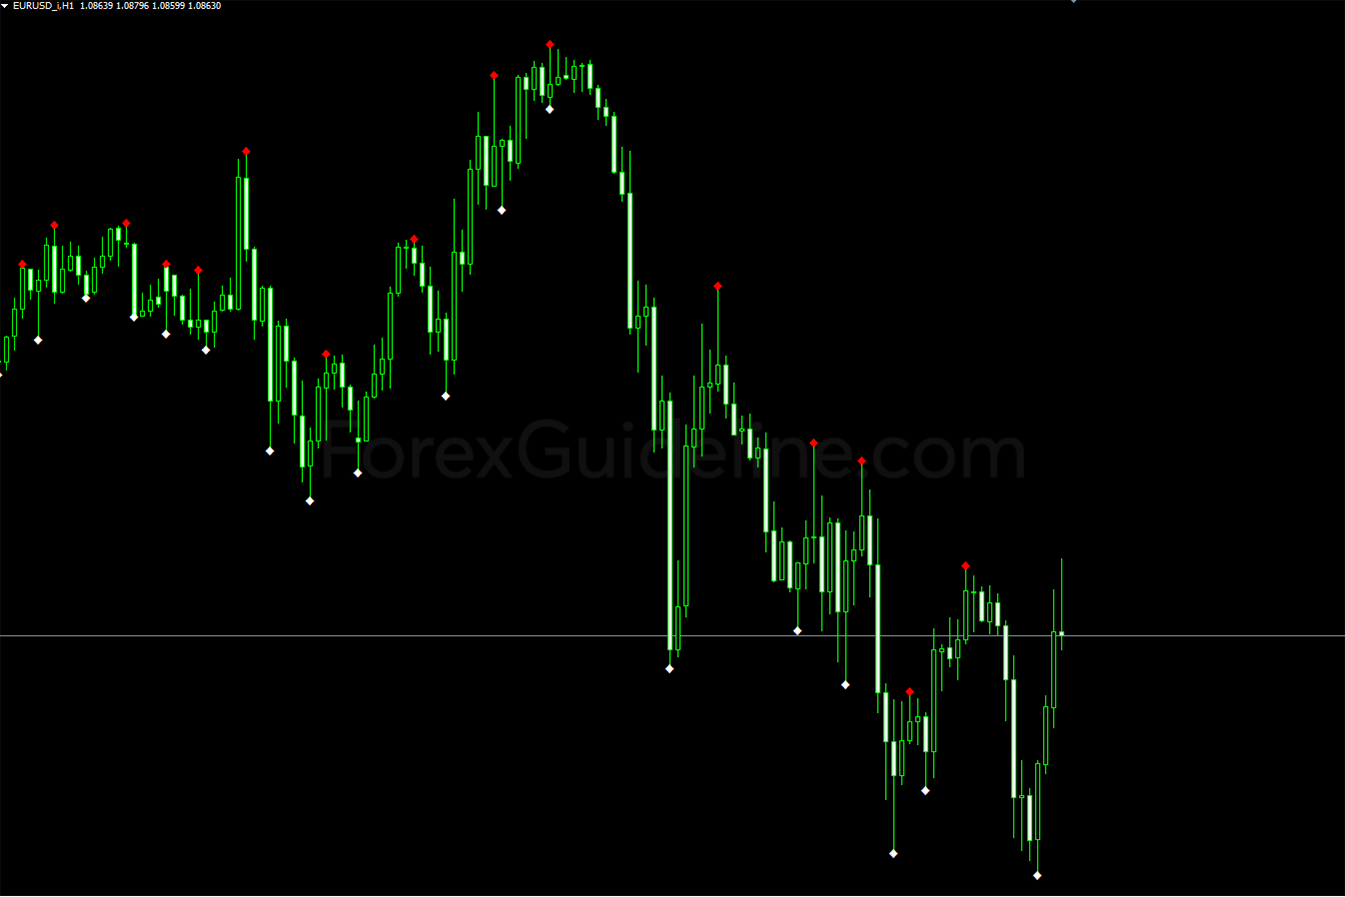
Fractals Indicator plots potential turning points on a price chart. It then draws arrows to indicate the existence of a pattern. The bullish … Read More»
Daily Pivot Points Indicator
Daily Pivot Points Indicator plots pivot points on charts that can be used to find support and resistance levels based on previous turning … Read More»

