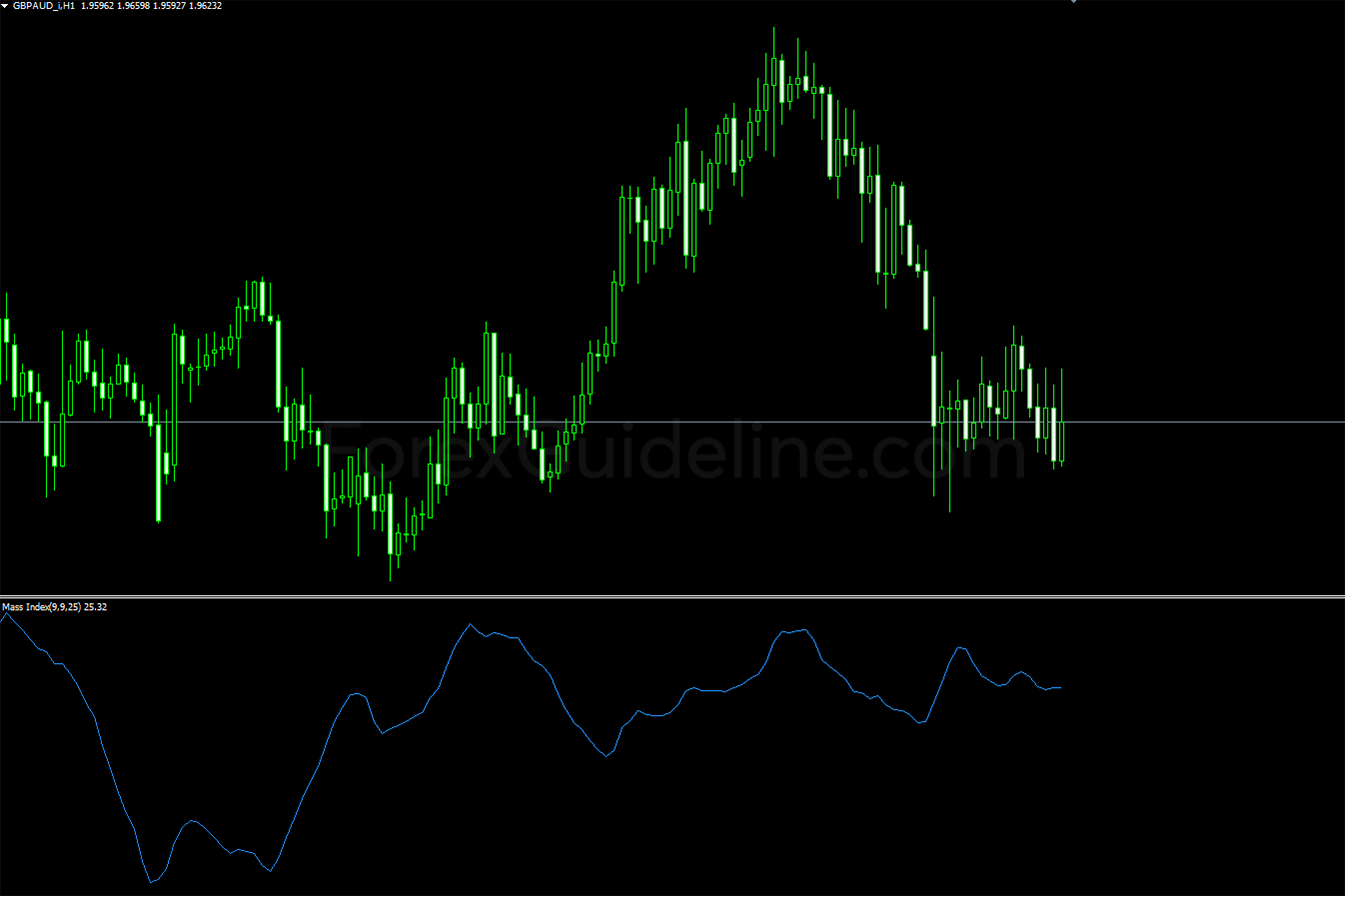
Mass Index Indicator examines the range between high-low prices over a period of time to identify trend reversals based on range expansions. A … Read More»
Free Forex Indicators
Heiken Ashi Indicator
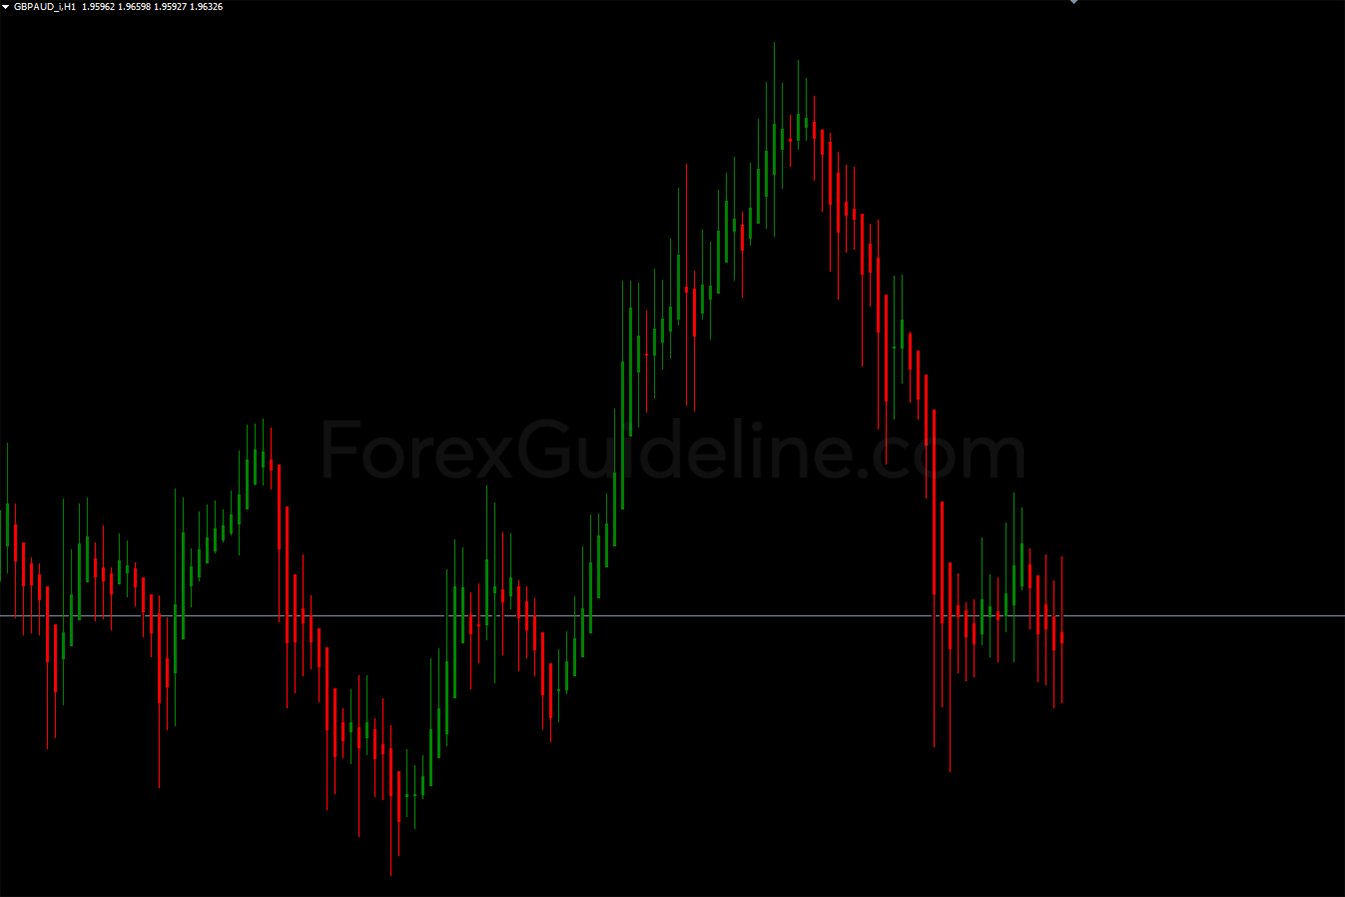
Heiken Ashi Indicator can be used in conjunction with candlestick charts when trading assets to spot market trends and predict future prices. It’s … Read More»
Gator Oscillator Indicator
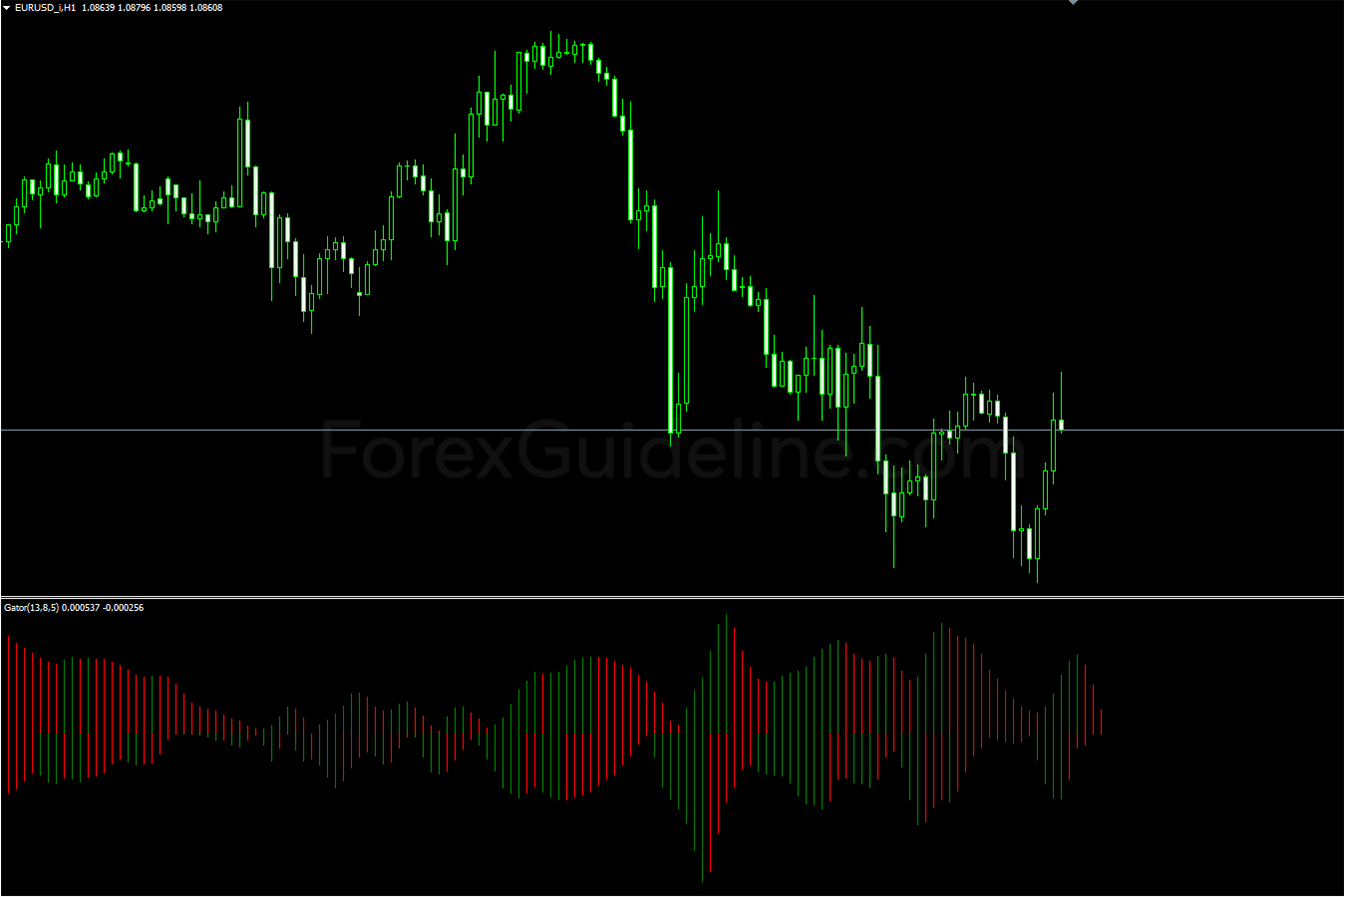
The Gator Oscillator Indicator helps to detect trend changes in an asset’s price. The Gator is very similar to the Alligator Indicator and … Read More»
Fractals MTF Indicator
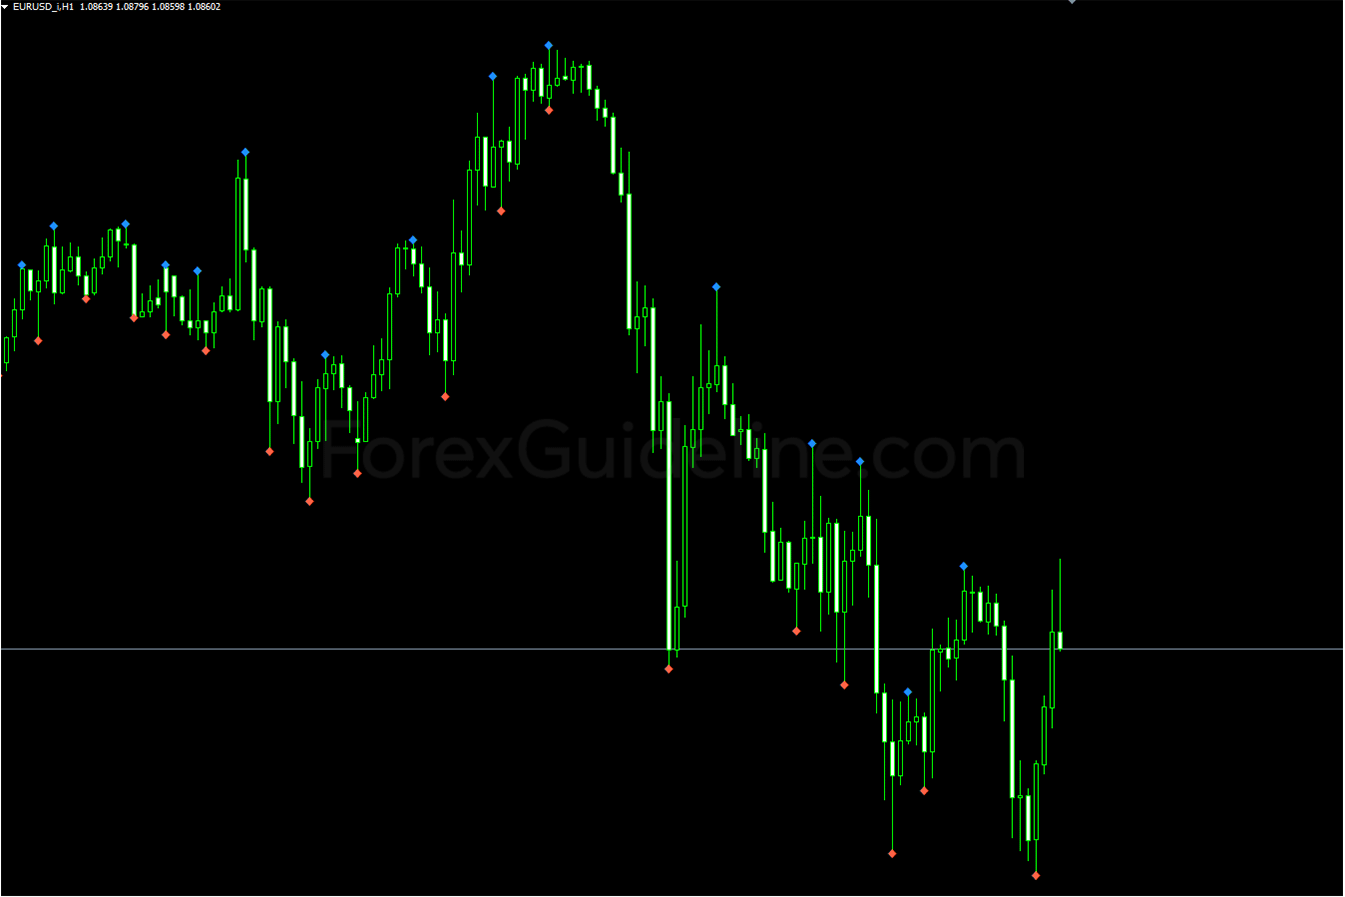
The Fractals MTF is a MetaTrader 4 (MT4) indicator that can be used with any Forex Trading System for extra confirmation to enter … Read More»
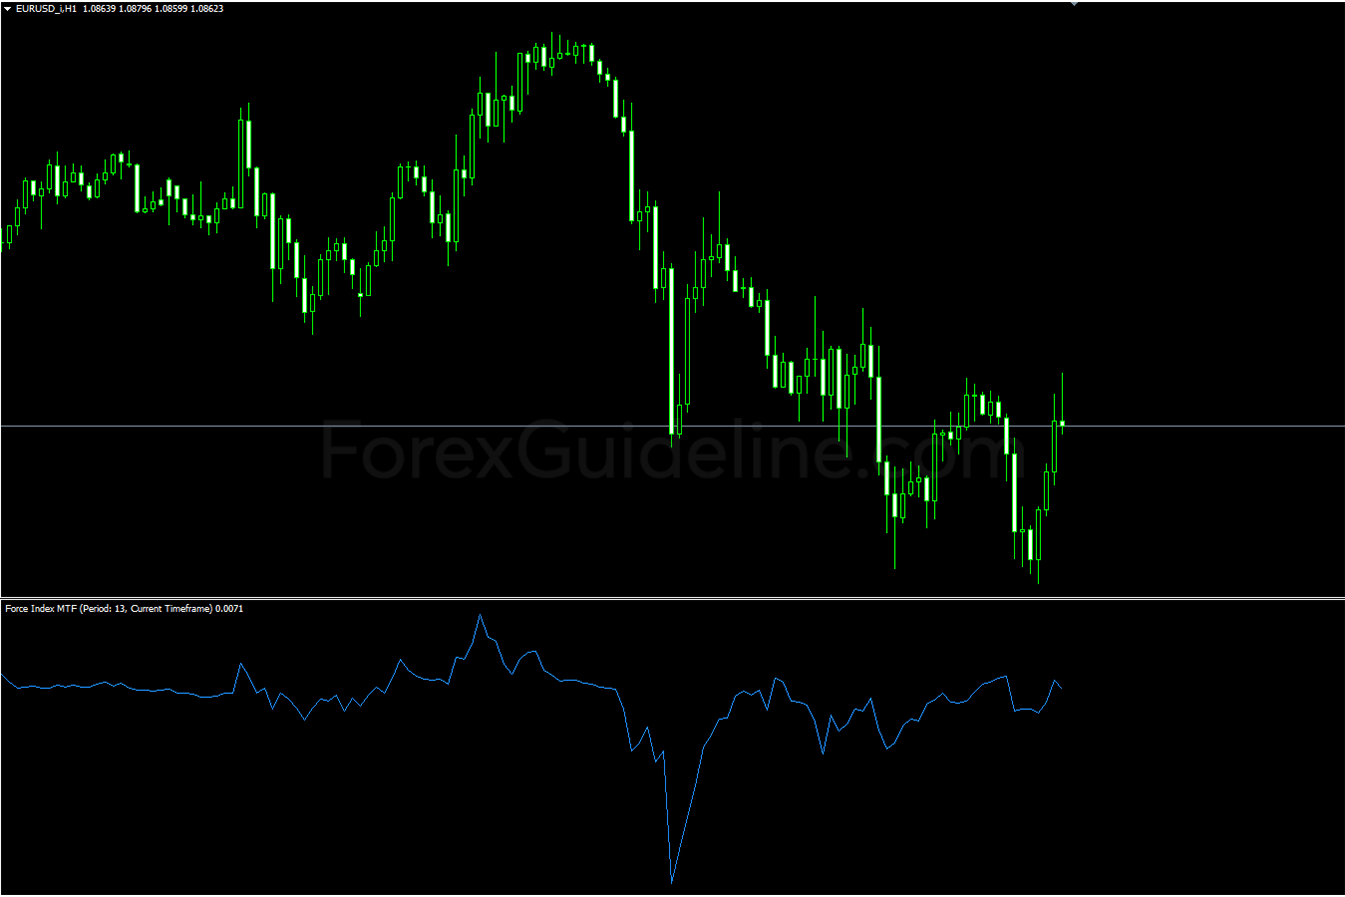
Force Index MTF Indicator
The Force Index MTF is a MetaTrader 4 (MT4) indicator that can be used with any Forex Trading System for extra confirmation to … Read More»
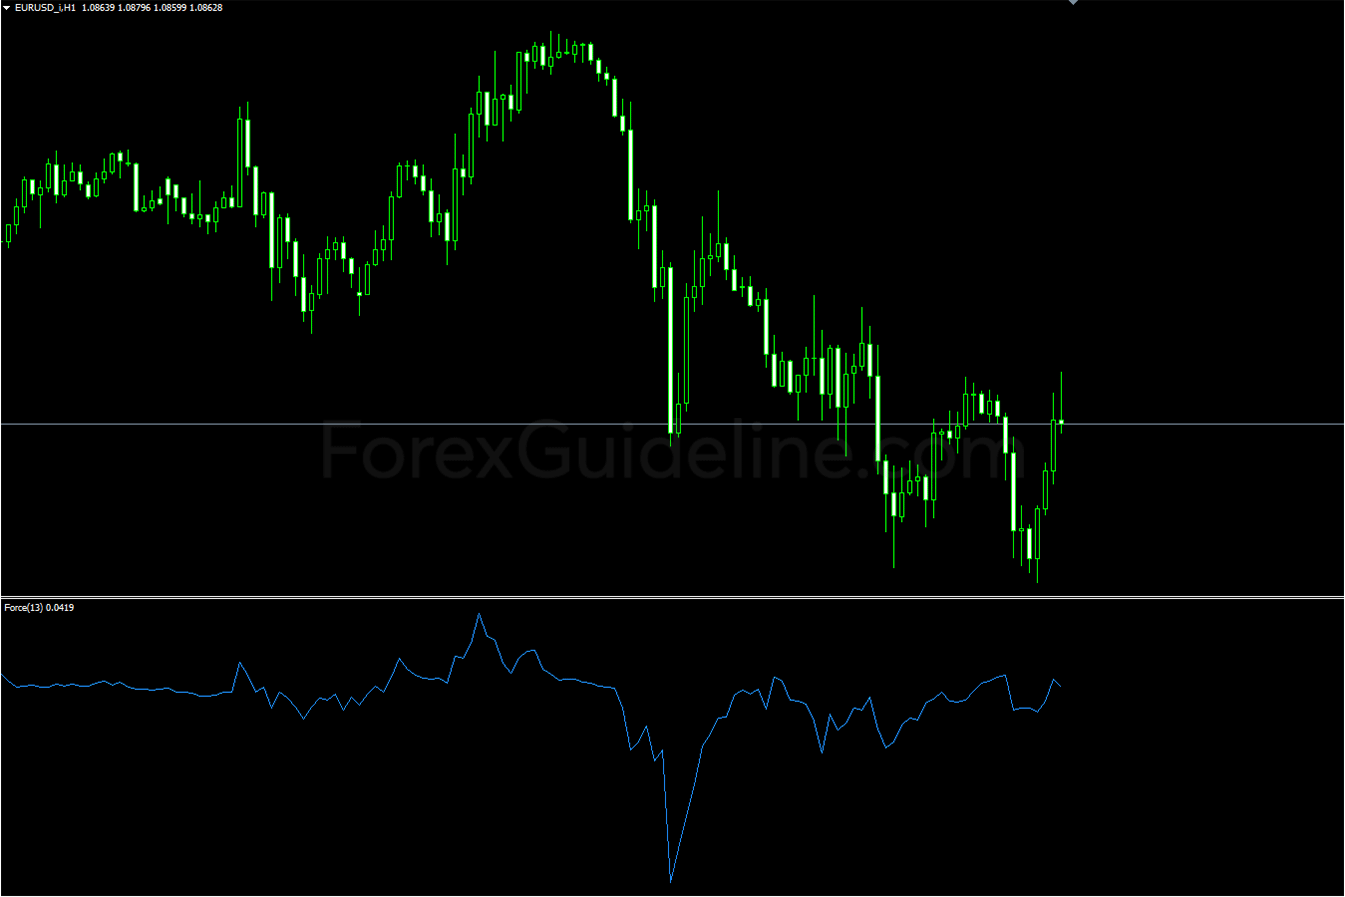
Force Index (FI) Indicator
The Force Index (FI) Indicator is used in technical analysis to determine how strong the actual buying or selling pressure is. High positive … Read More»
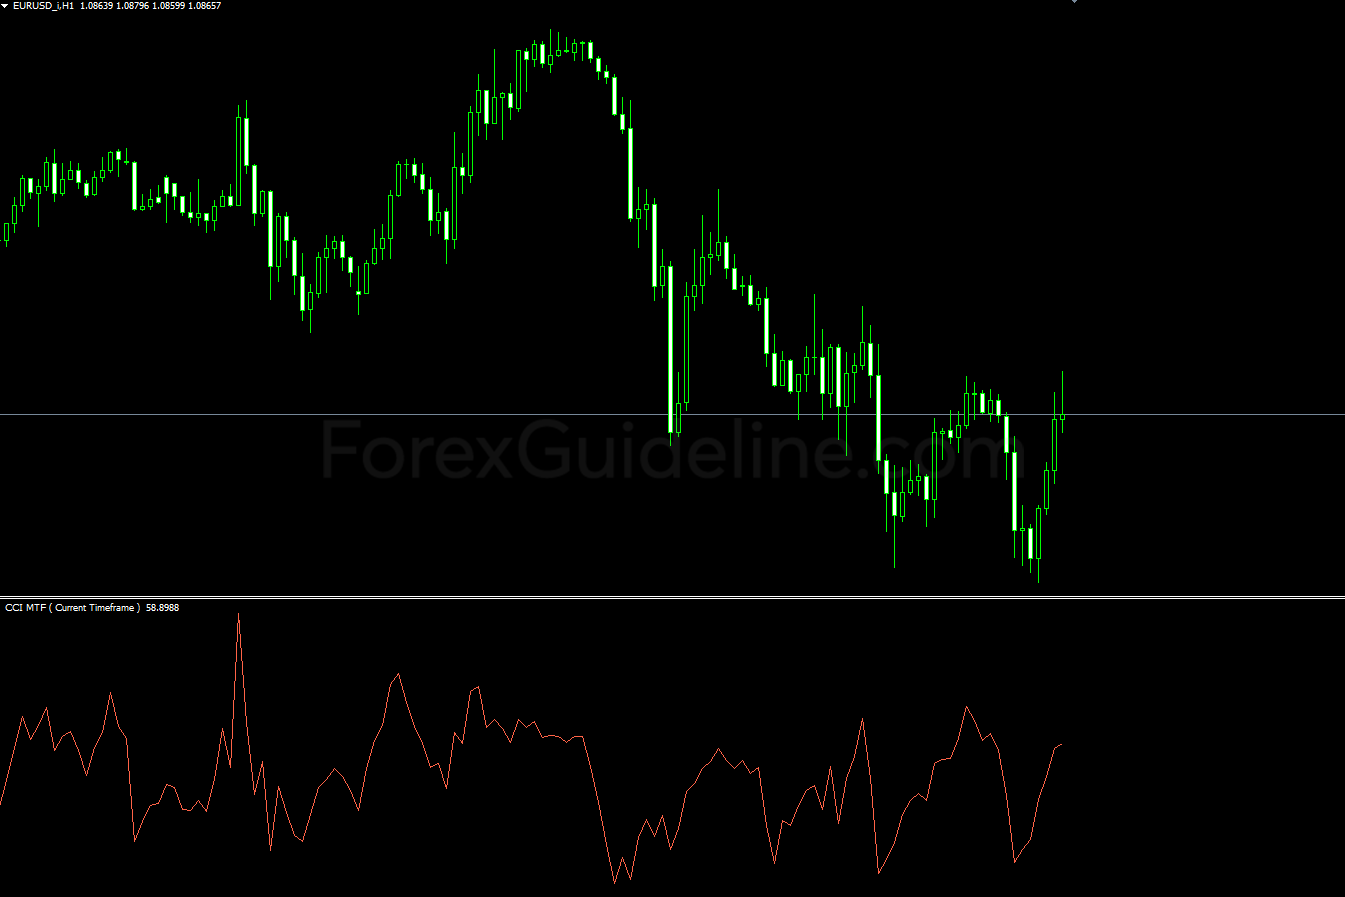
Commodity Channel Index MTF Indicator
The Commodity Channel Index Mtf Commodity Channel Index Mtf Indicator is a MetaTrader 4 (MT4) indicator that can be used with any Forex … Read More»
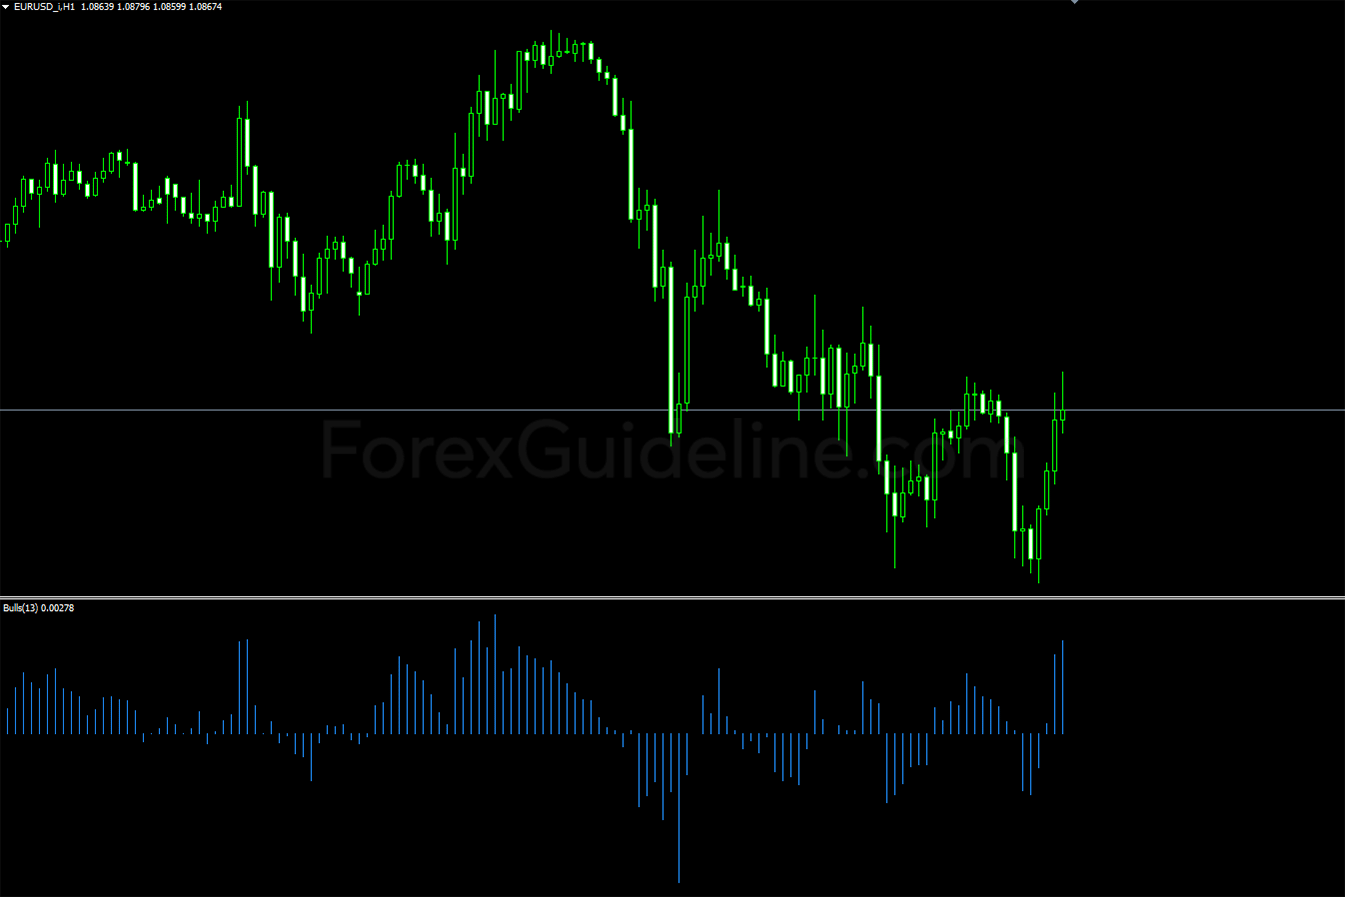
Bulls Power Indicator
The Bulls Power indicator measures the difference between the lowest price and a 13-day Exponential Moving Average (EMA), plotted as a histogram. If … Read More»
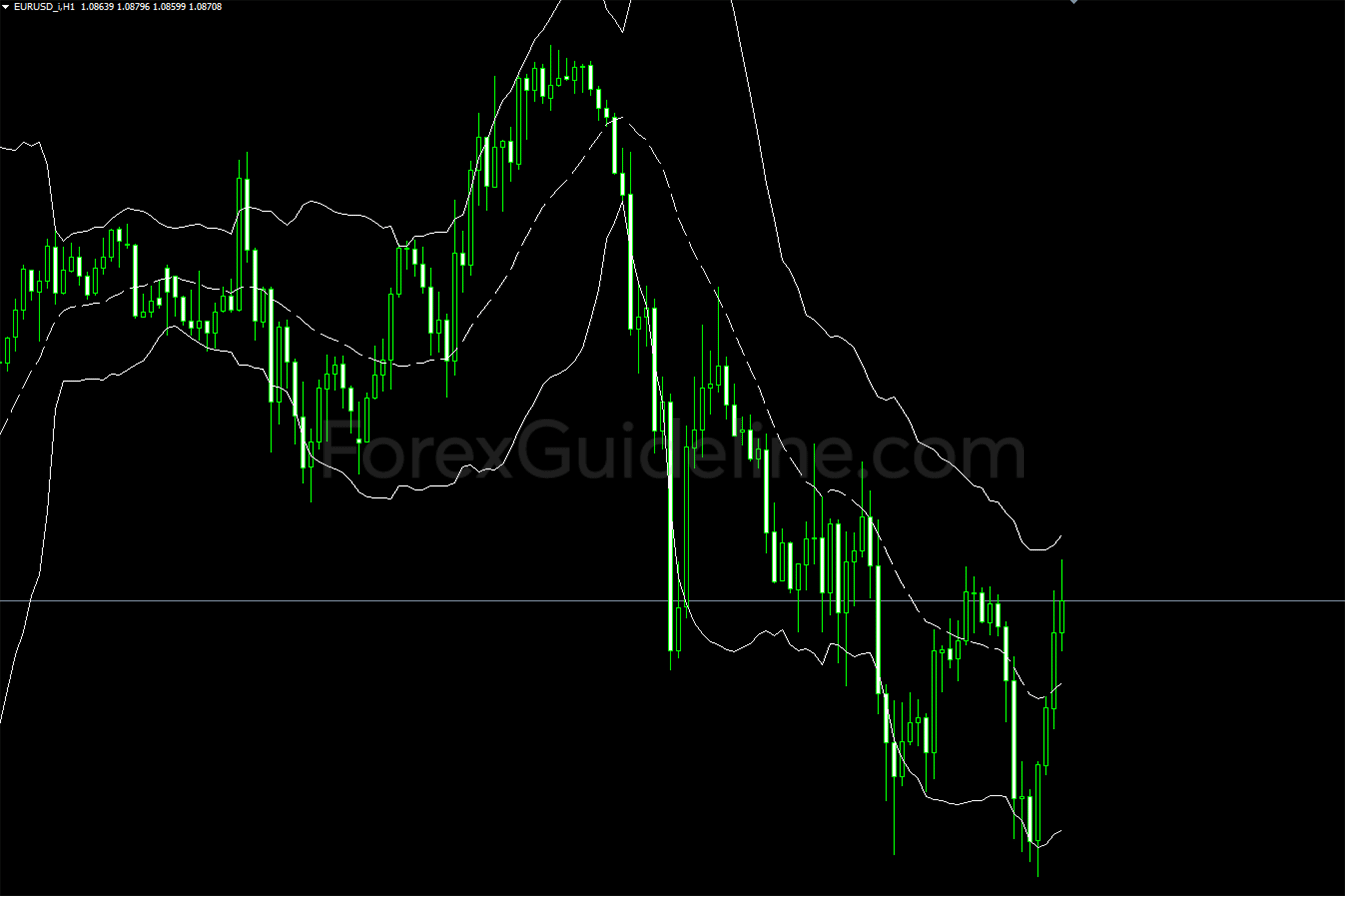
Bollinger Bands MTF Indicator
The Bollinger Bands MTF Bollinger Bands Mtf Indicator is a MetaTrader 4 (MT4) indicator that can be used with any Forex Trading System … Read More»
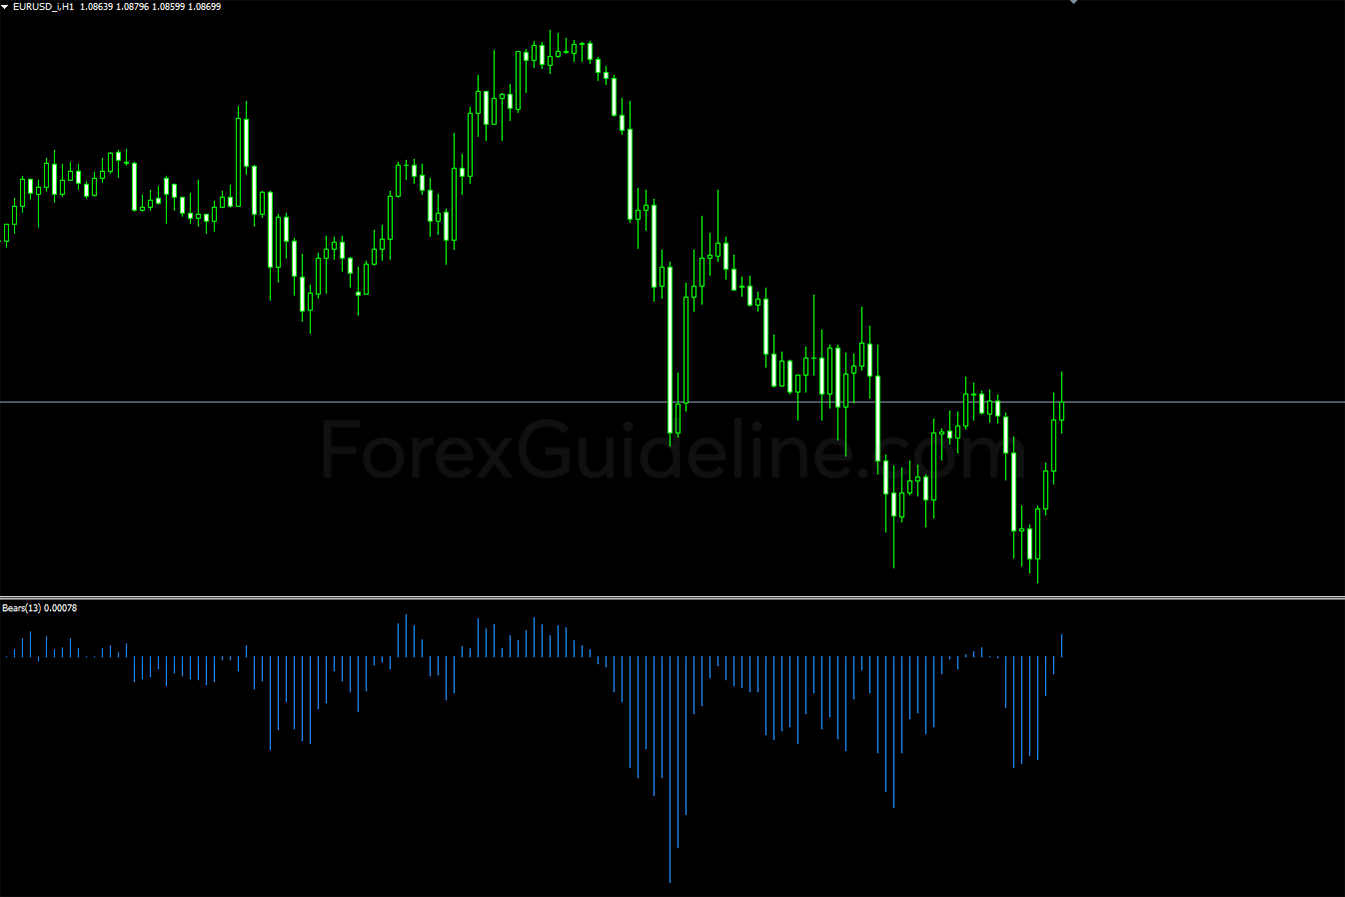
Bears Power Indicator
The Bears Power indicator measures the difference between the lowest price and a 13-day Exponential Moving Average (EMA), plotted as a histogram. If … Read More»

