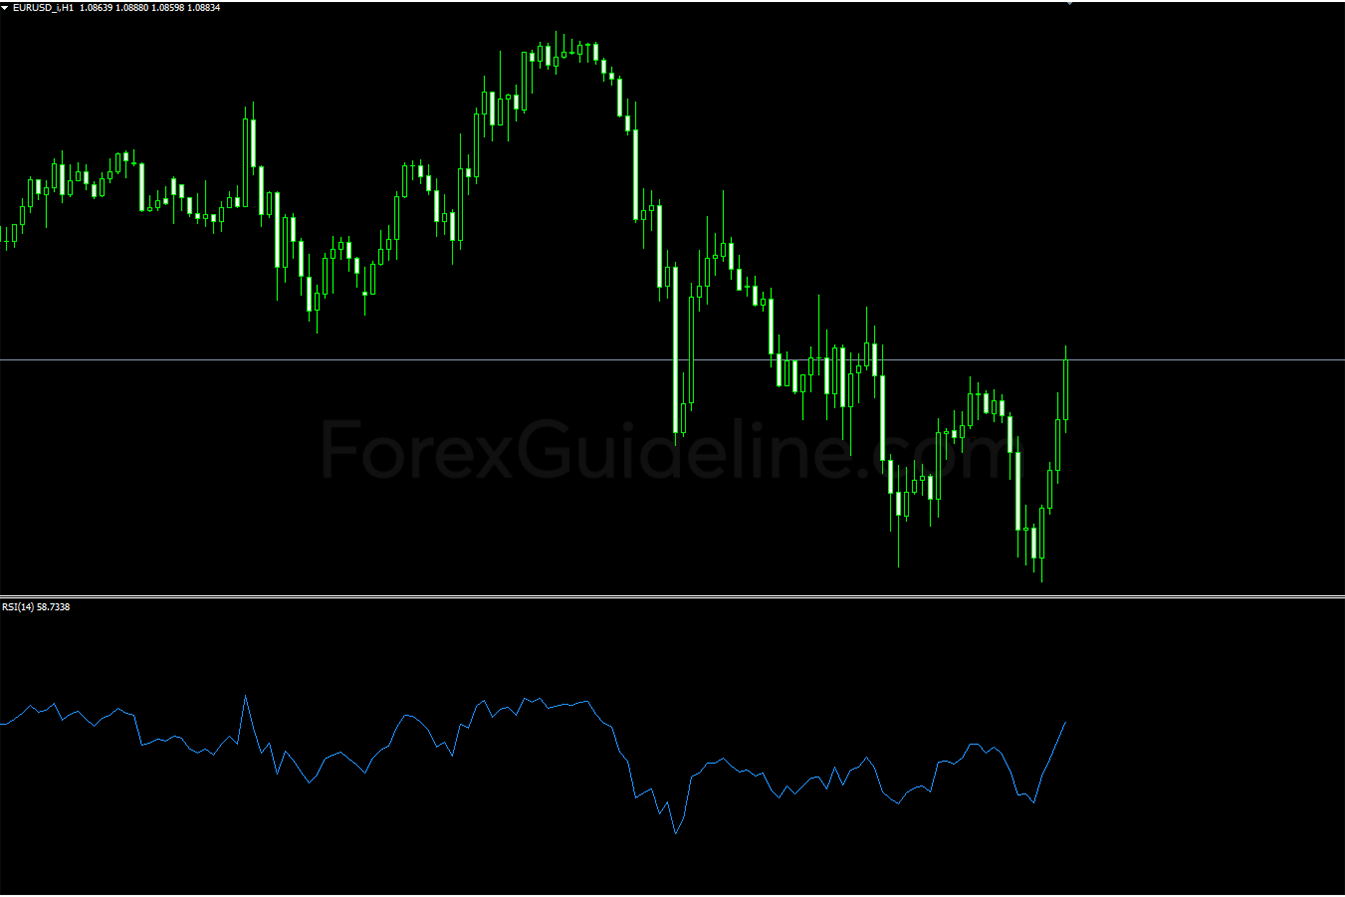
Relative Strength Index (RSI) Indicator is a technical indicator that measures the magnitude of recent price changes to evaluate overbought or oversold conditions … Read More»
Forex Indicators
Best forex indicators mt4 youtube forex non repaint indicators volatility indicators forex winning indicators 2020 best forex strategies free forex indicators metatrader 4 currency strength indicator and trend indicator mt4 are the best forex indicator combination forex trend indicators top forex indicators free download price action strategy infinity scalper forex reversal patterns.
Parabolic SAR MTF Indicator
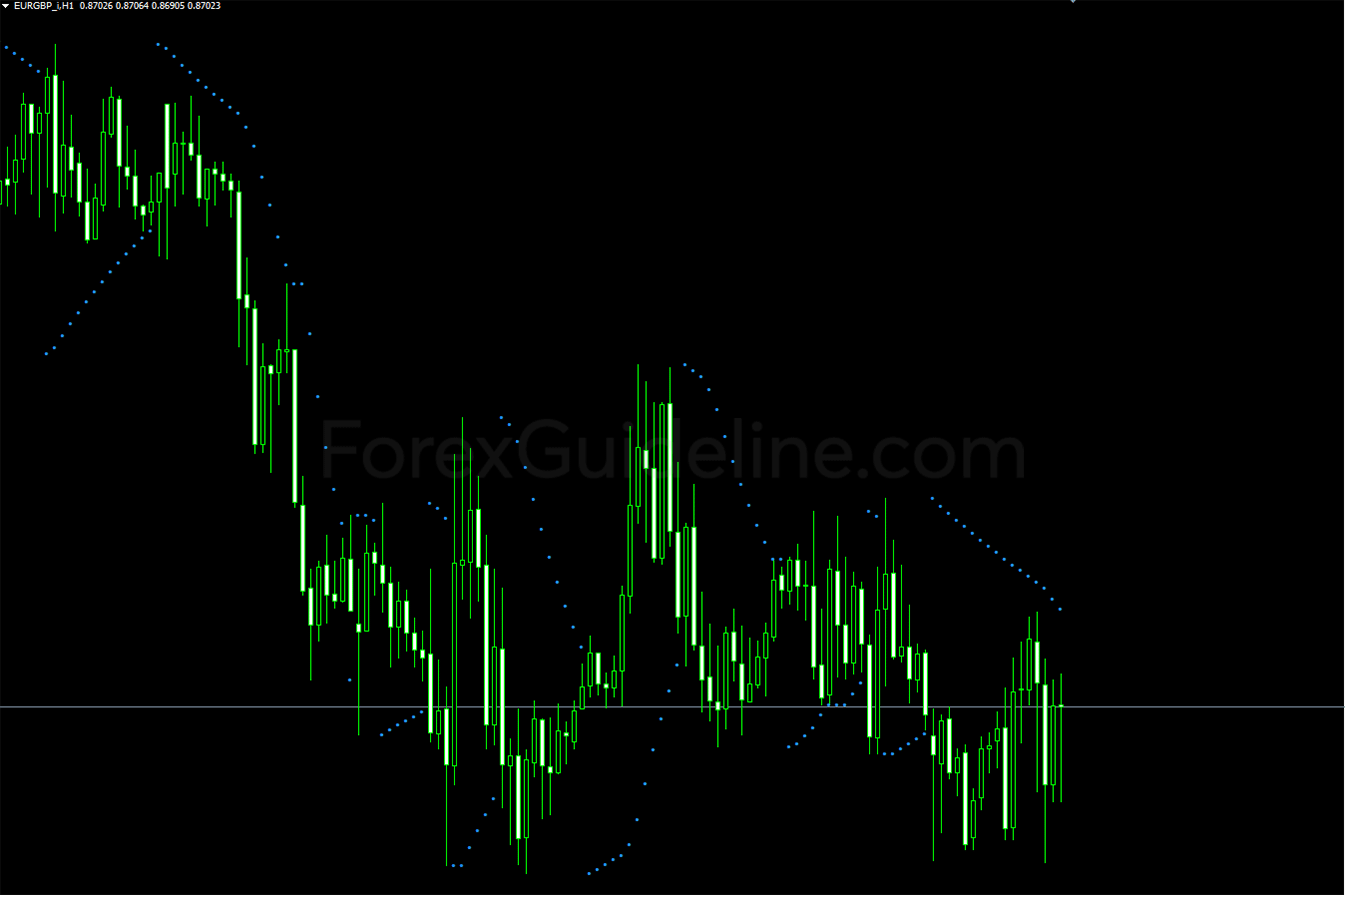
The Parabolic SAR MTF is a MetaTrader 4 (MT4) indicator that can be used with any Forex Trading System for extra confirmation to … Read More»
Parabolic SAR Indicator
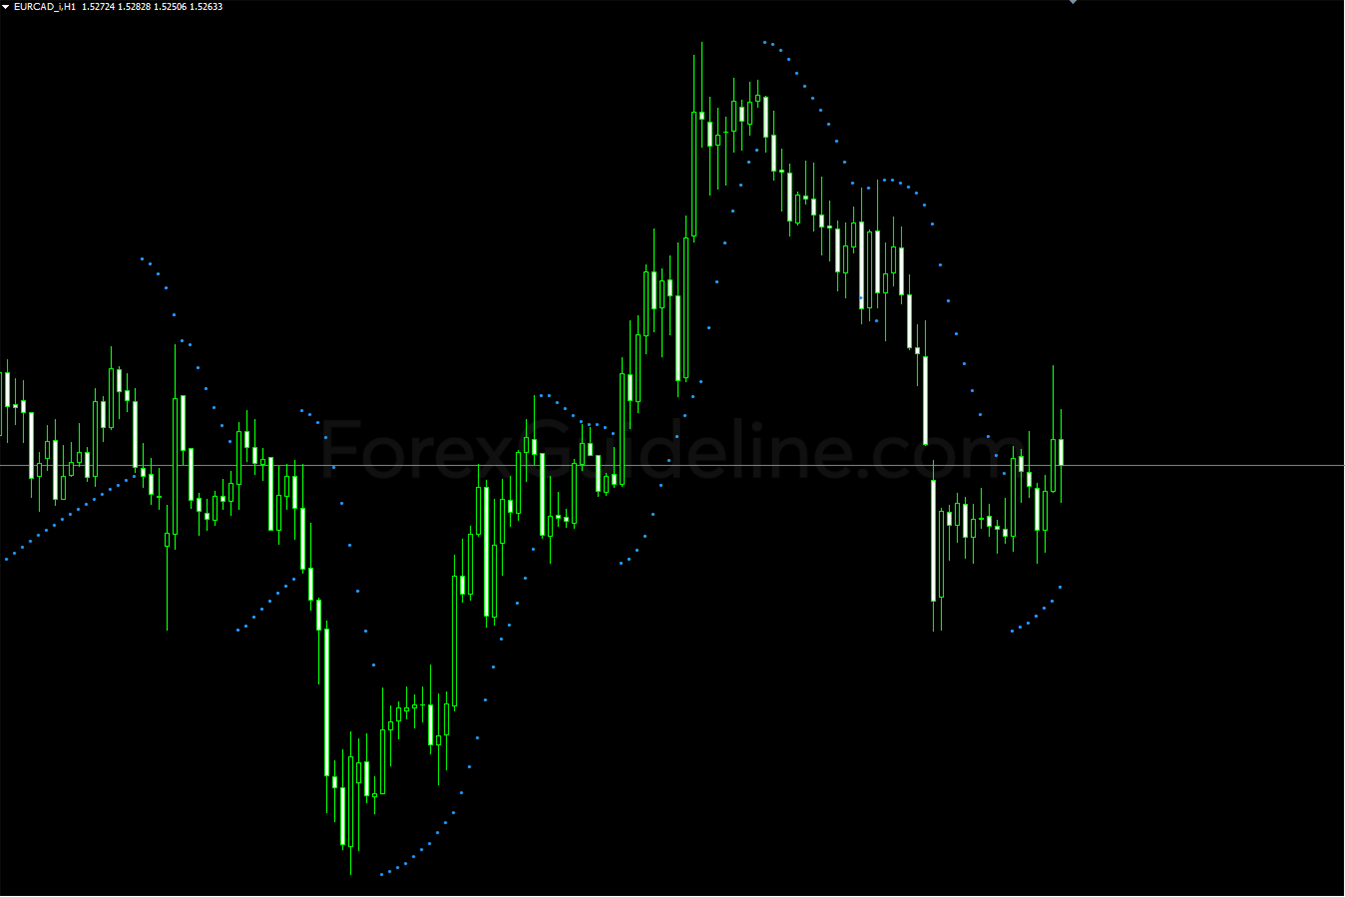
Parabolic SAR Indicator is a technical indicator used to determine trend direction and potential reversals in price. It uses a trailing stop and … Read More»
Oscillator of a Moving Average (OsMA) Indicator
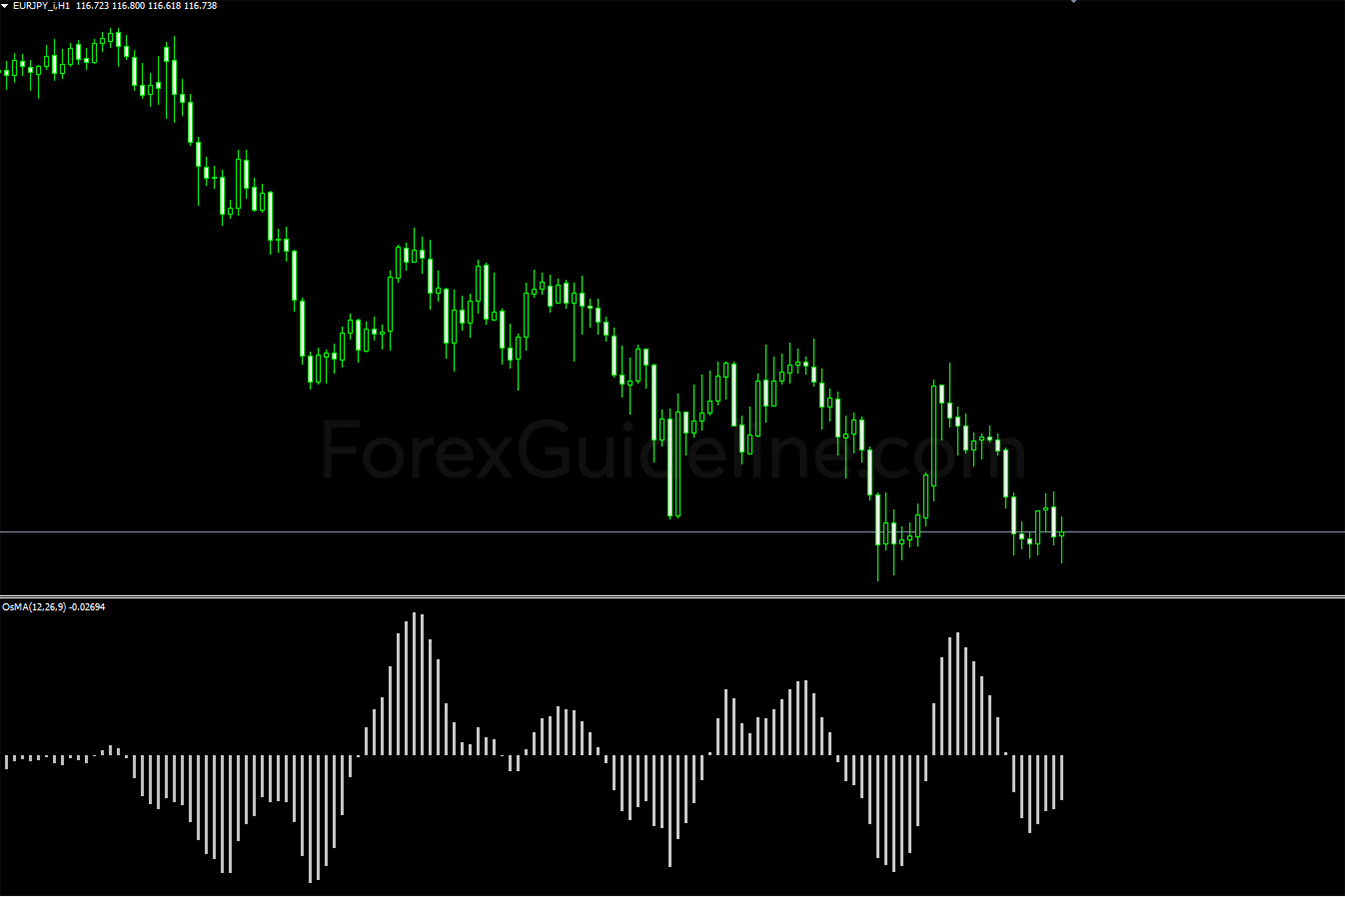
The Oscillator of a Moving Average (OsMA) is a technical indicator that shows the difference between an oscillator (MACD) and its moving average … Read More»
Moving Average MTF Indicator
The Moving Average MTF is a MetaTrader 4 (MT4) indicator that can be used with any Forex Trading System for extra confirmation to … Read More»
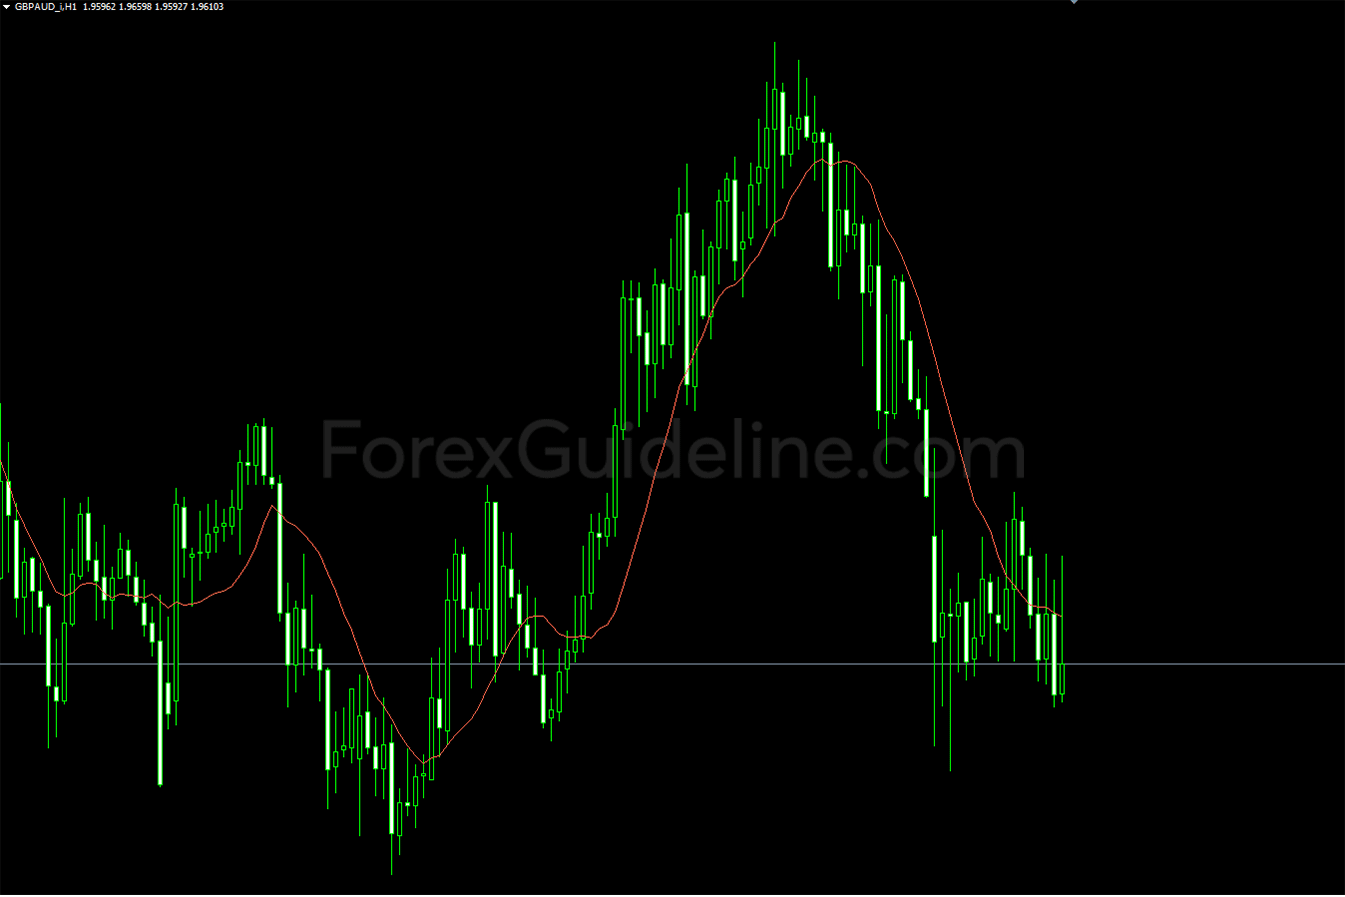
Moving Average (MA) Indicator
Moving average indicator is a trend-following, or lagging, indicator as it is based on past prices. It is used to identify the trend … Read More»
Momentum MTF Indicator
The Momentum MTF Indicator is a MetaTrader 4 (MT4) indicator that can be used with any Forex Trading System for extra confirmation to … Read More»
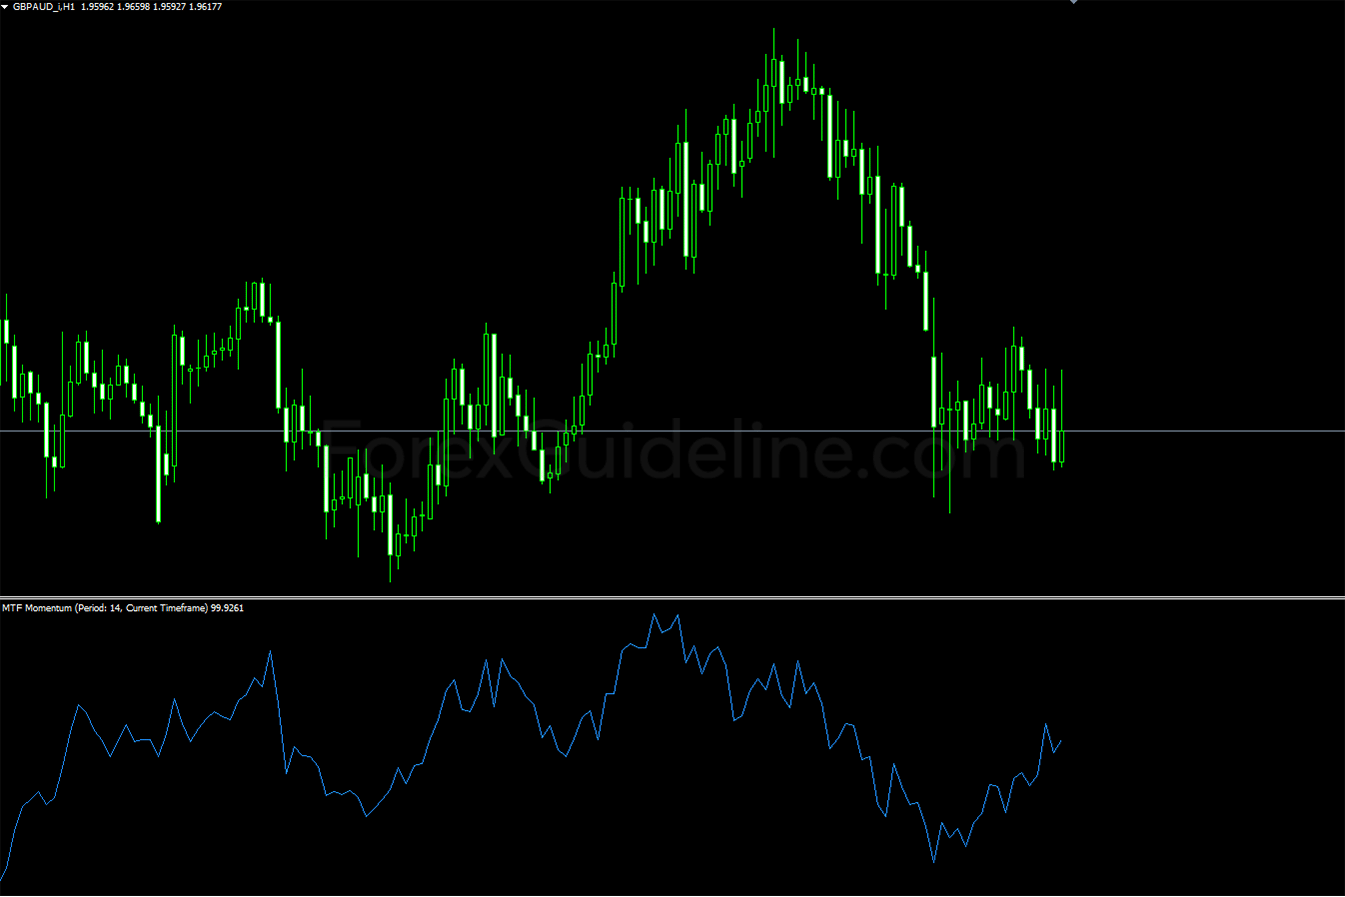
Momentum Indicator
The Momentum Indicator identifies the strength of a price movement in a price chart. It compares the most recent closing price to a … Read More»
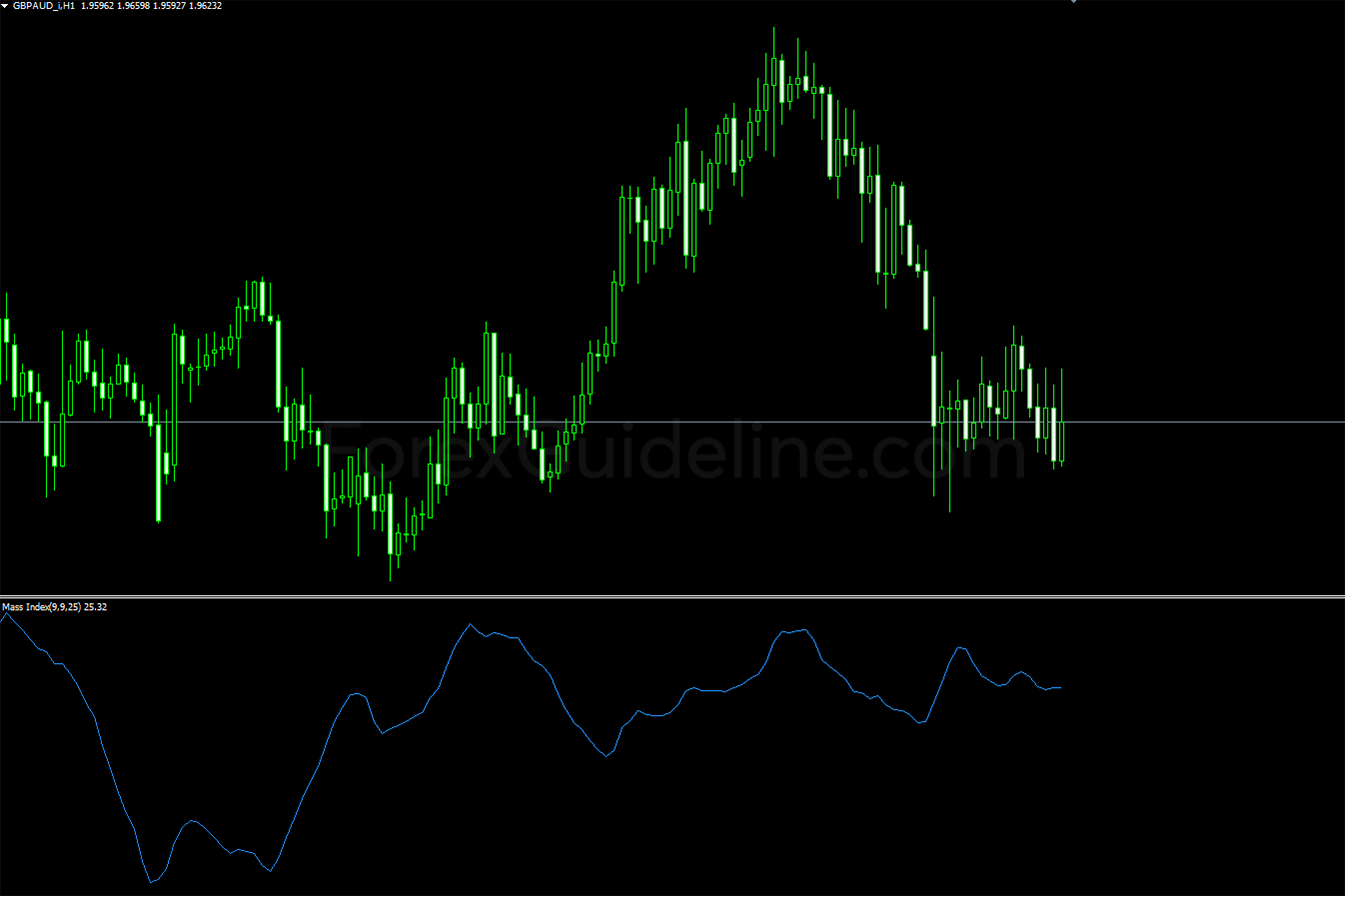
Mass Index Indicator
Mass Index Indicator examines the range between high-low prices over a period of time to identify trend reversals based on range expansions. A … Read More»
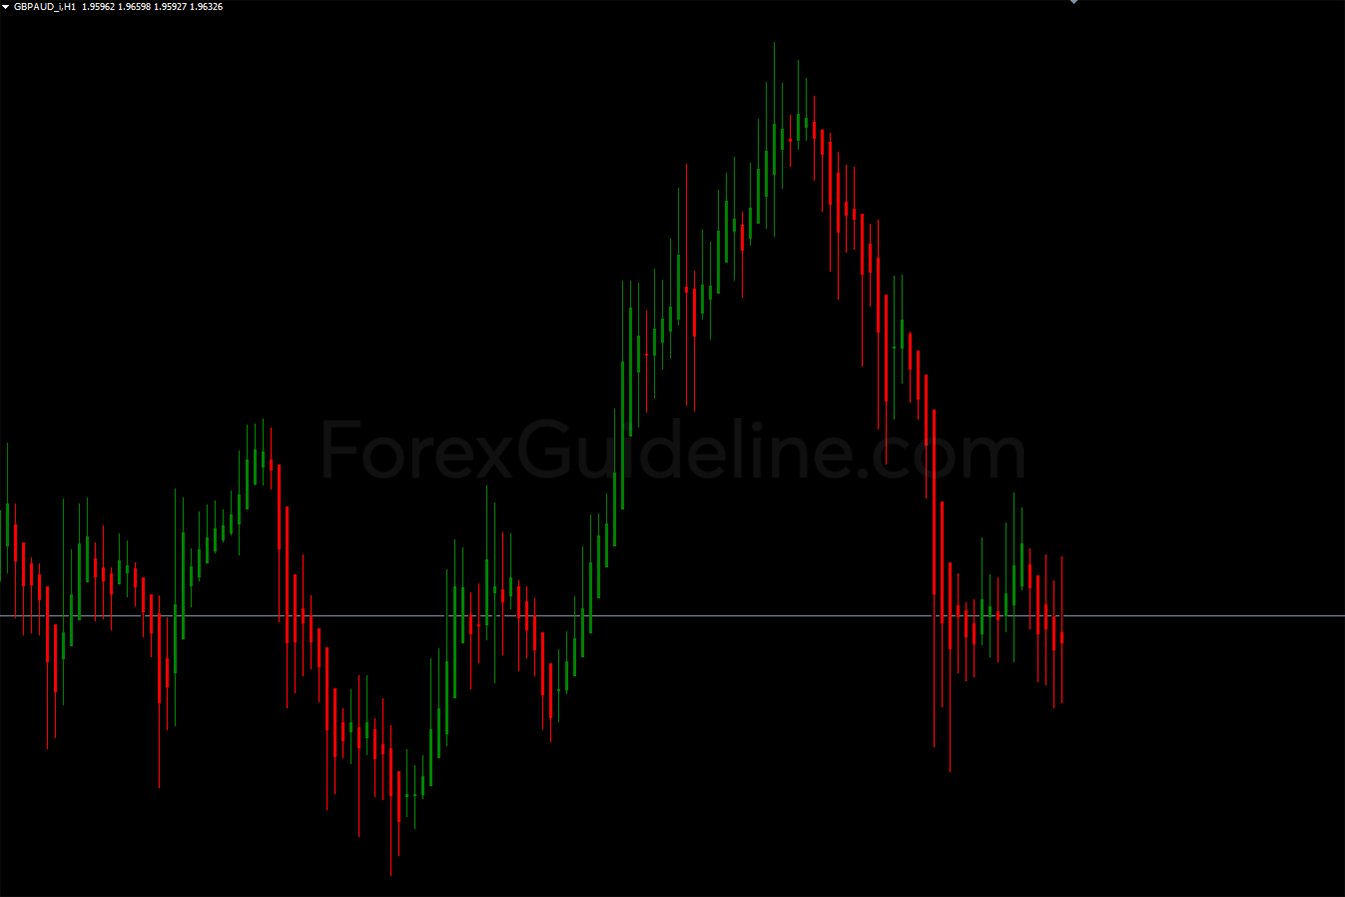
Heiken Ashi Indicator
Heiken Ashi Indicator can be used in conjunction with candlestick charts when trading assets to spot market trends and predict future prices. It’s … Read More»


